


リンク
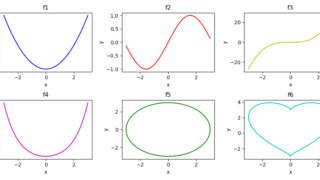
pythonで作ったグラフを動かそう。matplotlibをつかうとpythonで以下のようなアニメーションをつくることが出来る。 Jupyter Notebookを使う場合は先頭に
%matplotlib nbagg
をつける必要がある。
点を動かす
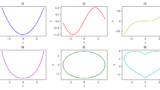
点を円の方程式に沿って動かす。
import matplotlib.pyplot as plt
import matplotlib.animation as animation
import numpy as np

dt = 0.01
fig = plt.figure()
ims = []

for i in range(int(1/dt)):
	t = dt*i

	x = np.cos(t*2*np.pi)
	y = np.sin(t*2*np.pi)
	im = plt.plot(x,y,color='b', marker='o', markersize=20)
	ims.append(im)

ani = animation.ArtistAnimation(fig,ims)
plt.show()
グラフを動かす
import matplotlib.pyplot as plt
import matplotlib.animation as animation

dt = 0.1
dx = 0.1
fig = plt.figure()
ims = []
for i in range(int(2/dt)):
	t = dt*i
	x_list = []
	y_list = []

	for i in range(int(-10/dx),int(10/dx+1)):
		x = dx*i
		y = t*x**2
		x_list.append(x)
		y_list.append(y)

	im = plt.plot(x_list,y_list,color='b')
	ims.append(im)

ani = animation.ArtistAnimation(fig,ims)
plt.show()
アニメーションの保存
gifで保存する場合は
ani.save('animation.gif', writer="imagemagick")
mp4で保存する場合は
ani.save("animation.mp4", writer="ffmpeg")
を付け足します。gifで保存する場合はImageMagickをmp4で保存する場合はffmpegをインストールしておきましょう。グラフの書き方は以下の記事で書いてます。
また、テキストも動かす場合こちら
リンク
コメント